


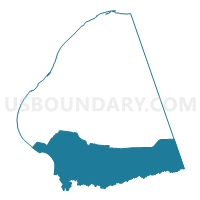
Census Tract 9503, Ballard County, Kentucky
About
Outline

Summary
| Unique Area Identifier | 459438 |
| Name | Census Tract 9503 |
| County | Ballard County |
| State | Kentucky |
| Area (square miles) | 71.63 |
| Land Area (square miles) | 68.33 |
| Water Area (square miles) | 3.30 |
| % of Land Area | 95.39 |
| % of Water Area | 4.61 |
| Latitude of the Internal Point | 36.97271370 |
| Longtitude of the Internal Point | -88.97868330 |
| Total Population | 2,496 |
| Total Housing Units | 1,181 |
| Total Households | 1,008 |
| Median Age | 41.7 |
Maps

Graphs
Select a template below for downloading or customizing gragh for Census Tract 9503, Ballard County, Kentucky


Neighbors
Neighoring Census Tract (by Name) Neighboring Census Tract on the Map
- Census Tract 316, McCracken County, KY
- Census Tract 9501, Ballard County, KY
- Census Tract 9501, Mississippi County, MO
- Census Tract 9502, Ballard County, KY
- Census Tract 9579, Alexander County, IL
- Census Tract 9601, Carlisle County, KY
- Census Tract 9602, Carlisle County, KY
Top 10 Neighboring County Subdivision (by Population) Neighboring County Subdivision on the Map
- La Center CCD, Ballard County, KY (4,259)
- Camelia CCD, McCracken County, KY (2,892)
- Cairo precinct, Alexander County, IL (2,831)
- Wickliffe CCD, Ballard County, KY (2,496)
- Bardwell CCD, Carlisle County, KY (1,854)
- Cunningham CCD, Carlisle County, KY (1,599)
- Barlow CCD, Ballard County, KY (1,494)
- Ohio township, Mississippi County, MO (563)
Top 10 Neighboring Place (by Population) Neighboring Place on the Map
- Cairo city, IL (2,831)
- Wickliffe city, KY (688)
- Lovelaceville CDP, KY (148)
- Blandville city, KY (90)
Top 10 Neighboring Unified School District (by Population) Neighboring Unified School District on the Map
- McCracken County School District, KY (45,095)
- Charleston R-I School District, MO (8,525)
- Ballard County School District, KY (8,249)
- Carlisle County School District, KY (5,104)
- Cairo Community Unit School District 1, IL (3,218)
Top 10 Neighboring State Legislative District Lower Chamber (by Population) Neighboring State Legislative District Lower Chamber on the Map
- State House District 118, IL (99,068)
- State House District 2, KY (41,936)
- State House District 1, KY (37,943)
- State House District 161, MO (34,576)
Top 10 Neighboring State Legislative District Upper Chamber (by Population) Neighboring State Legislative District Upper Chamber on the Map
- State Senate District 59, IL (209,843)
- State Senate District 27, MO (172,783)
- State Senate District 1, KY (113,784)
- State Senate District 2, KY (105,262)
Top 10 Neighboring 111th Congressional District (by Population) Neighboring 111th Congressional District on the Map
- Congressional District 1, KY (686,989)
- Congressional District 12, IL (666,459)
- Congressional District 8, MO (656,894)
Top 10 Neighboring 5-Digit ZIP Code Tabulation Area (by Population) Neighboring 5-Digit ZIP Code Tabulation Area on the Map
- 42001, KY (27,960)
- 63834, MO (7,135)
- 42053, KY (4,931)
- 62914, IL (3,147)
- 42023, KY (2,422)
- 42087, KY (2,419)
- 42056, KY (1,982)
- 42021, KY (1,505)
- 42024, KY (1,490)
- 42035, KY (1,068)
Data
Demographic, Population, Households, and Housing Units
** Data sources from census 2010 **
Show Data on Map
Download Full List as CSV
Download Quick Sheet as CSV
| Subject | This Area | Ballard County | Kentucky | National |
|---|---|---|---|---|
| POPULATION | ||||
| Total Population Map | 2,496 | 8,249 | 4,339,367 | 308,745,538 |
| POPULATION, HISPANIC OR LATINO ORIGIN | ||||
| Not Hispanic or Latino Map | 2,458 | 8,159 | 4,206,531 | 258,267,944 |
| Hispanic or Latino Map | 38 | 90 | 132,836 | 50,477,594 |
| POPULATION, RACE | ||||
| White alone Map | 2,368 | 7,808 | 3,809,537 | 223,553,265 |
| Black or African American alone Map | 58 | 238 | 337,520 | 38,929,319 |
| American Indian and Alaska Native alone Map | 4 | 14 | 10,120 | 2,932,248 |
| Asian alone Map | 2 | 15 | 48,930 | 14,674,252 |
| Native Hawaiian and Other Pacific Islander alone Map | 1 | 1 | 2,501 | 540,013 |
| Some Other Race alone Map | 12 | 21 | 55,551 | 19,107,368 |
| Two or More Races Map | 51 | 152 | 75,208 | 9,009,073 |
| POPULATION, SEX | ||||
| Male Map | 1,264 | 4,096 | 2,134,952 | 151,781,326 |
| Female Map | 1,232 | 4,153 | 2,204,415 | 156,964,212 |
| POPULATION, AGE (18 YEARS) | ||||
| 18 years and over Map | 1,937 | 6,421 | 3,315,996 | 234,564,071 |
| Under 18 years | 559 | 1,828 | 1,023,371 | 74,181,467 |
| POPULATION, AGE | ||||
| Under 5 years | 144 | 431 | 282,367 | 20,201,362 |
| 5 to 9 years | 159 | 498 | 282,888 | 20,348,657 |
| 10 to 14 years | 151 | 557 | 284,154 | 20,677,194 |
| 15 to 17 years | 105 | 342 | 173,962 | 12,954,254 |
| 18 and 19 years | 58 | 201 | 122,833 | 9,086,089 |
| 20 years | 22 | 71 | 61,268 | 4,519,129 |
| 21 years | 25 | 79 | 58,657 | 4,354,294 |
| 22 to 24 years | 72 | 256 | 170,043 | 12,712,576 |
| 25 to 29 years | 148 | 405 | 285,296 | 21,101,849 |
| 30 to 34 years | 153 | 477 | 280,920 | 19,962,099 |
| 35 to 39 years | 156 | 538 | 285,411 | 20,179,642 |
| 40 to 44 years | 162 | 565 | 291,251 | 20,890,964 |
| 45 to 49 years | 161 | 581 | 323,642 | 22,708,591 |
| 50 to 54 years | 198 | 656 | 319,455 | 22,298,125 |
| 55 to 59 years | 193 | 590 | 288,027 | 19,664,805 |
| 60 and 61 years | 86 | 230 | 106,469 | 7,113,727 |
| 62 to 64 years | 108 | 322 | 144,497 | 9,704,197 |
| 65 and 66 years | 59 | 207 | 78,497 | 5,319,902 |
| 67 to 69 years | 74 | 255 | 107,167 | 7,115,361 |
| 70 to 74 years | 94 | 348 | 139,650 | 9,278,166 |
| 75 to 79 years | 77 | 262 | 105,392 | 7,317,795 |
| 80 to 84 years | 65 | 207 | 78,313 | 5,743,327 |
| 85 years and over | 26 | 171 | 69,208 | 5,493,433 |
| MEDIAN AGE BY SEX | ||||
| Both sexes Map | 41.70 | 42.40 | 38.10 | 37.20 |
| Male Map | 40.40 | 40.70 | 36.70 | 35.80 |
| Female Map | 42.70 | 44.20 | 39.30 | 38.50 |
| HOUSEHOLDS | ||||
| Total Households Map | 1,008 | 3,397 | 1,719,965 | 116,716,292 |
| HOUSEHOLDS, HOUSEHOLD TYPE | ||||
| Family households: Map | 709 | 2,372 | 1,149,905 | 77,538,296 |
| Husband-wife family Map | 576 | 1,909 | 848,324 | 56,510,377 |
| Other family: Map | 133 | 463 | 301,581 | 21,027,919 |
| Male householder, no wife present Map | 51 | 149 | 82,545 | 5,777,570 |
| Female householder, no husband present Map | 82 | 314 | 219,036 | 15,250,349 |
| Nonfamily households: Map | 299 | 1,025 | 570,060 | 39,177,996 |
| Householder living alone Map | 262 | 881 | 473,447 | 31,204,909 |
| Householder not living alone Map | 37 | 144 | 96,613 | 7,973,087 |
| HOUSEHOLDS, HISPANIC OR LATINO ORIGIN OF HOUSEHOLDER | ||||
| Not Hispanic or Latino householder: Map | 1,000 | 3,374 | 1,685,985 | 103,254,926 |
| Hispanic or Latino householder: Map | 8 | 23 | 33,980 | 13,461,366 |
| HOUSEHOLDS, RACE OF HOUSEHOLDER | ||||
| Householder who is White alone | 969 | 3,258 | 1,540,334 | 89,754,352 |
| Householder who is Black or African American alone | 18 | 88 | 128,856 | 14,129,983 |
| Householder who is American Indian and Alaska Native alone | 2 | 6 | 4,014 | 939,707 |
| Householder who is Asian alone | 0 | 3 | 15,476 | 4,632,164 |
| Householder who is Native Hawaiian and Other Pacific Islander alone | 1 | 1 | 667 | 143,932 |
| Householder who is Some Other Race alone | 2 | 2 | 13,756 | 4,916,427 |
| Householder who is Two or More Races | 16 | 39 | 16,862 | 2,199,727 |
| HOUSEHOLDS, HOUSEHOLD TYPE BY HOUSEHOLD SIZE | ||||
| Family households: Map | 709 | 2,372 | 1,149,905 | 77,538,296 |
| 2-person household Map | 361 | 1,179 | 512,506 | 31,882,616 |
| 3-person household Map | 158 | 552 | 279,227 | 17,765,829 |
| 4-person household Map | 109 | 405 | 215,271 | 15,214,075 |
| 5-person household Map | 49 | 157 | 92,558 | 7,411,997 |
| 6-person household Map | 18 | 52 | 32,372 | 3,026,278 |
| 7-or-more-person household Map | 14 | 27 | 17,971 | 2,237,501 |
| Nonfamily households: Map | 299 | 1,025 | 570,060 | 39,177,996 |
| 1-person household Map | 262 | 881 | 473,447 | 31,204,909 |
| 2-person household Map | 34 | 131 | 79,041 | 6,360,012 |
| 3-person household Map | 1 | 5 | 11,214 | 992,156 |
| 4-person household Map | 1 | 6 | 4,493 | 411,171 |
| 5-person household Map | 0 | 1 | 1,290 | 126,634 |
| 6-person household Map | 1 | 1 | 354 | 48,421 |
| 7-or-more-person household Map | 0 | 0 | 221 | 34,693 |
| HOUSING UNITS | ||||
| Total Housing Units Map | 1,181 | 3,885 | 1,927,164 | 131,704,730 |
| HOUSING UNITS, OCCUPANCY STATUS | ||||
| Occupied Map | 1,008 | 3,397 | 1,719,965 | 116,716,292 |
| Vacant Map | 173 | 488 | 207,199 | 14,988,438 |
| HOUSING UNITS, OCCUPIED, TENURE | ||||
| Owned with a mortgage or a loan Map | 431 | 1,436 | 757,084 | 52,979,430 |
| Owned free and clear Map | 381 | 1,234 | 424,187 | 23,006,644 |
| Renter occupied Map | 196 | 727 | 538,694 | 40,730,218 |
| HOUSING UNITS, VACANT, VACANCY STATUS | ||||
| For rent Map | 17 | 62 | 56,960 | 4,137,567 |
| Rented, not occupied Map | 4 | 7 | 3,059 | 206,825 |
| For sale only Map | 14 | 40 | 27,286 | 1,896,796 |
| Sold, not occupied Map | 7 | 24 | 8,687 | 421,032 |
| For seasonal, recreational, or occasional use Map | 15 | 69 | 38,616 | 4,649,298 |
| For migrant workers Map | 0 | 0 | 627 | 24,161 |
| Other vacant Map | 116 | 286 | 71,964 | 3,652,759 |
| HOUSING UNITS, OCCUPIED, AVERAGE HOUSEHOLD SIZE BY TENURE | ||||
| Total: Map | 2.41 | 2.39 | 2.45 | 2.58 |
| Owner occupied Map | 2.38 | 2.41 | 2.51 | 2.65 |
| Renter occupied Map | 2.53 | 2.32 | 2.31 | 2.44 |
| HOUSING UNITS, OCCUPIED, TENURE BY RACE OF HOUSEHOLDER | ||||
| Owner occupied: Map | 812 | 2,670 | 1,181,271 | 75,986,074 |
| Householder who is White alone Map | 790 | 2,577 | 1,108,967 | 63,446,275 |
| Householder who is Black or African American alone Map | 11 | 59 | 50,706 | 6,261,464 |
| Householder who is American Indian and Alaska Native alone Map | 1 | 3 | 2,063 | 509,588 |
| Householder who is Asian alone Map | 0 | 3 | 7,662 | 2,688,861 |
| Householder who is Native Hawaiian and Other Pacific Islander alone Map | 1 | 1 | 254 | 61,911 |
| Householder who is Some Other Race alone Map | 1 | 1 | 3,682 | 1,975,817 |
| Householder who is Two or More Races Map | 8 | 26 | 7,937 | 1,042,158 |
| Renter occupied: Map | 196 | 727 | 538,694 | 40,730,218 |
| Householder who is White alone Map | 179 | 681 | 431,367 | 26,308,077 |
| Householder who is Black or African American alone Map | 7 | 29 | 78,150 | 7,868,519 |
| Householder who is American Indian and Alaska Native alone Map | 1 | 3 | 1,951 | 430,119 |
| Householder who is Asian alone Map | 0 | 0 | 7,814 | 1,943,303 |
| Householder who is Native Hawaiian and Other Pacific Islander alone Map | 0 | 0 | 413 | 82,021 |
| Householder who is Some Other Race alone Map | 1 | 1 | 10,074 | 2,940,610 |
| Householder who is Two or More Races Map | 8 | 13 | 8,925 | 1,157,569 |
| HOUSING UNITS, OCCUPIED, TENURE BY HISPANIC OR LATINO ORIGIN OF HOUSEHOLDER | ||||
| Owner occupied: Map | 812 | 2,670 | 1,181,271 | 75,986,074 |
| Not Hispanic or Latino householder Map | 808 | 2,656 | 1,169,209 | 69,617,625 |
| Hispanic or Latino householder Map | 4 | 14 | 12,062 | 6,368,449 |
| Renter occupied: Map | 196 | 727 | 538,694 | 40,730,218 |
| Not Hispanic or Latino householder Map | 192 | 718 | 516,776 | 33,637,301 |
| Hispanic or Latino householder Map | 4 | 9 | 21,918 | 7,092,917 |
| HOUSING UNITS, OCCUPIED, TENURE BY HOUSEHOLD SIZE | ||||
| Owner occupied: Map | 812 | 2,670 | 1,181,271 | 75,986,074 |
| 1-person household Map | 200 | 611 | 269,220 | 16,453,569 |
| 2-person household Map | 344 | 1,125 | 449,271 | 27,618,605 |
| 3-person household Map | 126 | 438 | 204,423 | 12,517,563 |
| 4-person household Map | 79 | 312 | 159,701 | 10,998,793 |
| 5-person household Map | 38 | 122 | 65,252 | 5,057,765 |
| 6-person household Map | 14 | 41 | 21,816 | 1,965,796 |
| 7-or-more-person household Map | 11 | 21 | 11,588 | 1,373,983 |
| Renter occupied: Map | 196 | 727 | 538,694 | 40,730,218 |
| 1-person household Map | 62 | 270 | 204,227 | 14,751,340 |
| 2-person household Map | 51 | 185 | 142,276 | 10,624,023 |
| 3-person household Map | 33 | 119 | 86,018 | 6,240,422 |
| 4-person household Map | 31 | 99 | 60,063 | 4,626,453 |
| 5-person household Map | 11 | 36 | 28,596 | 2,480,866 |
| 6-person household Map | 5 | 12 | 10,910 | 1,108,903 |
| 7-or-more-person household Map | 3 | 6 | 6,604 | 898,211 |
Loading...